Page last updated Nov 21, 2015
Images of Pluto from the New Horizons spacecraft
(also see The Rotation of Pluto for images released on Nov 20, 2015)
Ice mountains on Pluto, imaged by the New Horizons spacecraft about 90 minutes before its closest encounter with Pluto, at a distance of about 47 thousand miles. The lack of cratering indicates the mountains are relatively young (probably between 100 and 200 million years old), but no mechanism has been proposed for the formation of such structures on an icy body like Pluto.
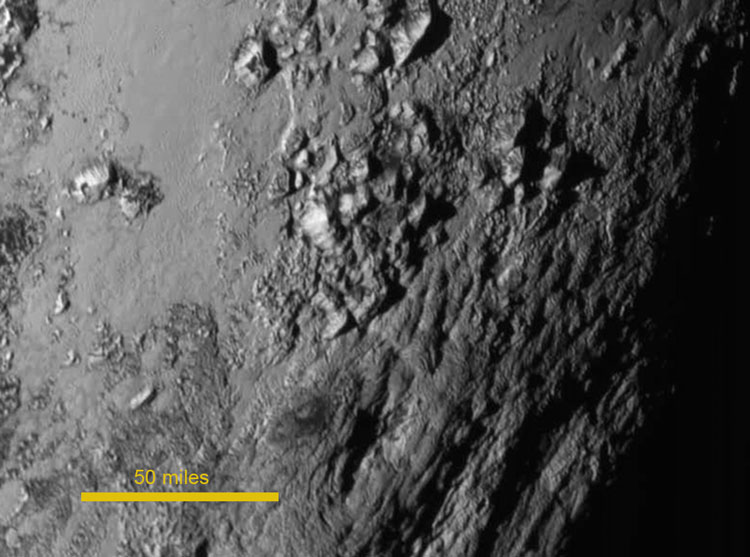
Below, the image above is superimposed on an image of the planet to show the region covered
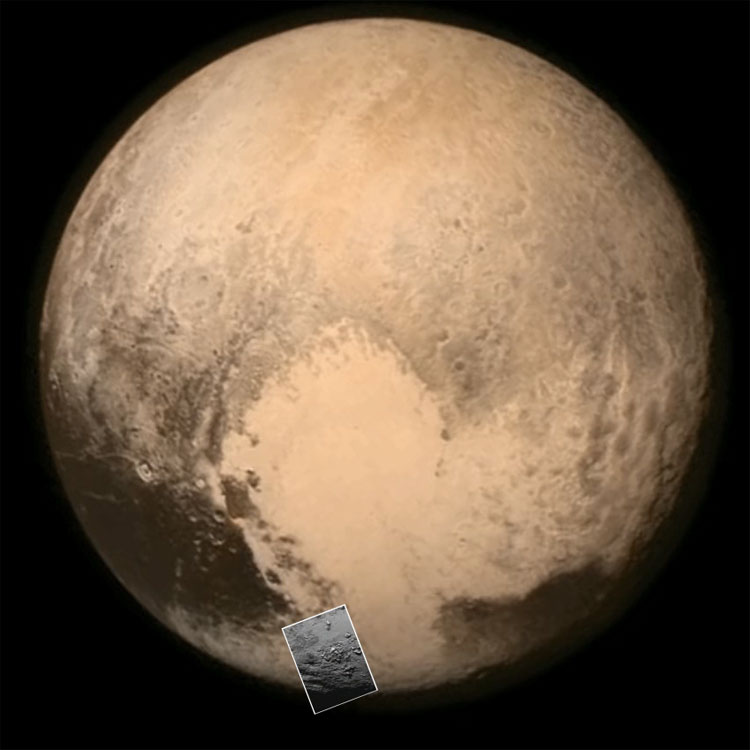
Below, the original image of the planet without the superimposed ice mountain image

Above, the last image transmitted by the New Horizons spacecraft before its flyby of Pluto
Taken at a distance of only 476,000 miles, about 16 hours before nearest approach
Compare to the image below, taken five days earlier about ten times further away

Above, an image of one side of Pluto taken by New Horizons spacecraft on Jul 8, 2015
Below, the "farside" of Pluto imaged three days (half a rotation) later

When the New Horizons probe zipped past Pluto at 30 thousand miles an hour on July 14, 2015, one side (mostly that of the upper image) was facing the Sun and the spacecraft, and available for detailed examination. The other side, shown in the lower image, was mostly turned away from the spacecraft and the Sun; so its image, taken from a distance of 2.5 million miles, is the best view we will have of that side of the planet for decades to come. Since that was the "farside" of the planet at the time of encounter, it was dubbed just that. Closeups of the "nearside" should enhance our knowledge of the planet, but for now the best guess is that the large circular features on the lower part of the "farside" image are impact craters, while the smoother upper region probably represents similar landscapes covered by ices formed as the planet's icy surface sublimates to form a thin atmosphere when it is nearest the Sun (most recently, from 1979 to 1999), then refreezes as it moves away from the Sun (over the next century or so).
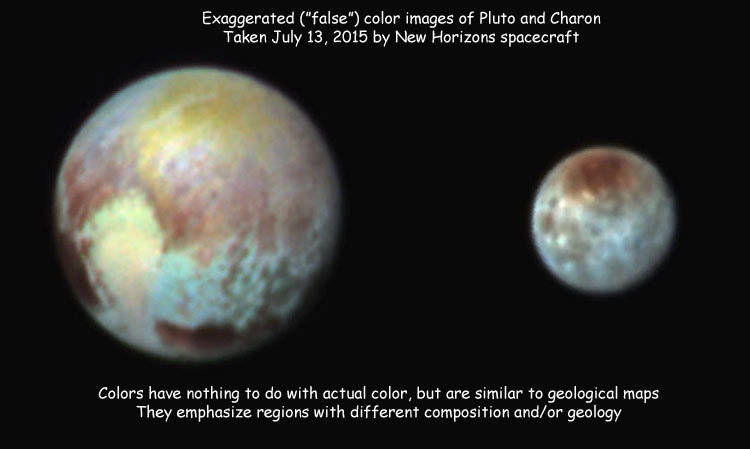
Below, false-color images of Pluto and Charon taken July 13, 2015, a day before the New Horizons spacecraft passed Pluto. Other than differences in brightness, the colors have nothing to do with the actual appearance of the objects (and even brightness differences are exaggerated). Instead, these are like geological maps, which are intended to show differences in composition and/or geology, and can be used as clues in interpreting more normal-color and black and white images.

Discovery photos of Pluto (Jan 23, left, and Jan 29, right, 1930). (Lowell Observatory Archives)
The arrows point to the position of Pluto in each image.

Alternating between the discovery images, as if using a blink comparator,
makes it easier to see the change in position of the previously unknown planet.

Discovery photos of Charon (Image Credit USNO)
Distorted image (left) shows Charon above Pluto, undistorted image (right) shows it in line with planet.

(Image credit NASA, ESA, and STScI
Ground Image: Canada-France-Hawaii Telescope, Hawaii)
Comparison of the best ground-based (left) and Hubble Space Telescope (right) photos of Pluto and Charon, in 1990. Further improvements in adaptive optics have improved ground-based images since these early images, but new HST cameras have improved space telescope images even more. Pluto is the brighter object at upper right, and Charon the fainter object at lower left. The diagram at the bottom shows the nearly edge-on orbital orientation that Charon had in 1990, and the position of Charon at the time the images were taken.

(Image credit Dr. R. Albrecht, ESA/ESO Space Telescope European Coordinating Facility, NASA)
A 1994 view of Pluto and Charon as observed by the repaired Hubble Space Telescope at maximum apparent separation (0.9 arc seconds apart). Pluto is on the left, 2390 km (= 1485 mi) diameter, Charon on right, 1190 km (= 740 mi) diameter. The bodies orbit each other at a distance of 19,600 km (= 12,200 mi). At the time this image was taken in 1994 Pluto was inside the orbit of Neptune -- a location it occupies for 20 years out of each 250 year orbital period. It was closer to the Sun than Neptune from 1979 to 1999.

A diagram showing the motion of Pluto around the Sun, and of Charon around Pluto. This diagram, borrowed from an obsolete astronomy text (which I no longer use save for this diagram), is flawed. It is useful in that it shows the large tilt of Pluto's rotational axis relative to its orbital motion and the consequently equally large tilt of Charon's orbital motion around Pluto, which is exactly parallel to Pluto's equator and rotation. However, as the illustration is drawn Charon's orbit would be in line with the Sun, and it would occult and be eclipsed by Pluto, in the lower "front" portion of the orbit. In reality Pluto and Charon are near the top right portion of the orbit, where Pluto is near perihelion and high above the orbit of the Earth (and Neptune) when the orbit of Charon lines up with the Sun. So the diagram shows the orbit of Charon (and rotation of Pluto) rotated by more than 90 degrees relative to the correct orientation. However, it is the best illustration I could find which would not be a clear violation of copyright law at the time I created this page, and any diagram seems better than none, as long as the problem is noted.

The gradually changing orientation of orbit of Charon, as seen from the Earth
(See The Rotation of Pluto for more details)

Bottom: Geometry of eclipses and occultations of Pluto and Charon in late 1980s
Top: Change in brightness of Pluto and Charon as a result of eclipses and occultations
(The original image has disappeared from the Web, but the paper it was based on is here)

(Image credit Eliot Young (SwRI) et al., NASA, apod010319) Color image of the side of Pluto which always faces Charon, showing details determined from the occultations and eclipses of Pluto and Charon shown in the previous image, in the mid to late 1980's. The brownish color is thought to be caused by darkening of methane ice as a result of exposure to ultraviolet radiation from the Sun. The light and dark areas represent just that -- light and dark areas -- and are unlikely to be related to actual surface features, which will remain unknown until the New Horizons spacecraft, launched in 2006, reaches Pluto in 2015.

(Image credit A. Stern (SwRI), M. Buie (Lowell Observatory), NASA, ESA, HubbleSite)The small images (inset at upper left of the larger images) are Hubble Space Telescope pictures of opposite hemispheres of Pluto taken in late June and early July of 1994, when Pluto was around 3 billion miles from Earth. Below each is a map based on a number of HST observations taken in blue light to provide increased resolution (the shorter the wavelength of light used to observe an object, the sharper the image can be). Although some features may correspond to basins or other topographic features it is most likely, as in the case of the Earth-based (color) image above, that the light and dark features simply represent differences in the brightness of the surface caused by differences in the ices deposited on the surface. Lighter areas are probably freshly deposited ices of nitrogen, carbon dioxide and methane, resulting from the re-freezing of gases which were produced as Pluto neared the Sun over the last century, and gradually developed a thin atmosphere of (primarily) nitrogen and methane. Dark areas are probably ices contaminated by hydrocarbon deposits formed by the interaction of methane and other ices with ultraviolet radiation from the Sun. As Pluto gradually draws away from the Sun over the next century, seasonal and orbital effects may produce noticeable changes in the patterns of light and dark ices shown here.

(Image credit Alan Stern (Southwest Research Institute), Marc Buie (Lowell Observatory), ESA, NASA)Map of Pluto constructed from four HST images as Pluto went through one 6.5 day rotation in 1994. The map shows a region 7500 km or 4700 miles wide (E to W) and half that height (N to S), save for a black strip at the bottom where the South Polar region could not be imaged, because it is pointing away from the Sun and Earth. (The rectilinear projection used here shows meridians of longitude and parallels of latitude as straight lines, and as a result shows the single point at the North Pole just as wide as Pluto's Equator, grossly exaggerating the size of the polar regions.) The polar areas are brighter and the equatorial area darker, as might be expected if there are more or fresher ices at the poles, but the actual nature of the dark and light regions will remain a matter of speculation for years or decades to come.

(Image credit NASA, ESA, and M. Buie (Southwest Research Institute), HubbleSite)
 Maps of Pluto based on Hubble Space Telescope photos taken in 2002-3. The original images were only a few pixels wide, so to obtain reasonably accurate maps, a bank of 20 computers operating continuously for four years (!!) was used to dither the images, compare the resulting data, and construct a model of the actual surface brightness at each position and in different wavelengths. By doing this color images were obtained which indicate not only different brightnesses, but also different compositions. Surface colors vary from white carbon monoxide frost (the bright area in the middle image), to dark orange and charcoal black regions in which ultraviolet radiation from the Sun is presumably breaking down methane ice molecules, creating a carbon-rich molasses-colored sludge, and lighter gases which quickly freeze, to create the brighter regions. It is expected that over the course of a Plutonian year (248 Earth years), the distribution of light and dark regions may significantly change, and the New Horizons spacecraft should reveal more details about the nature of the surface when it passes Pluto in 2015. As indicated by the labels on the two images above, the upper image shows twelve views rotated by 30 degrees in longitude; while the lower shows only three views rotated by 90 degrees, to allow a larger image of the maps to be displayed in the same horizontal space.

(Image credit NASA, ESA, and M. Buie (Southwest Research Institute), Hubblesite)
Changes in Pluto's surface brightness between 1994 and 2003, as revealed by a comparison of HST photomaps from those periods (the upper map is the same as the 1994 map shown a couple of images above, but shifted in longitude and noticeably "smoother" or less pixelated due to the extensive calculations discussed above). Sublimation of surface ices (primarily nitrogen and methane) in warmer areas and deposition of fresh ice in colder areas is changing the relative brightness of the two hemispheres. The difference in warmth is driven by the tilt of the axis of rotation of Pluto, but differences in its distance from the Sun are also important. As the planet moves away from perihelion (which was in late 1989) toward aphelion (which will be in 2112), it will become so cold that no part of the planet is warm enough for sublimation to occur, and as the atmosphere freezes out at the winter pole it will completely disappear. Note: In the Hubblesite news release it is stated that the Northern hemisphere is approaching summer, while an earlier NASA illustration of the rotation of Pluto shows that the Northern hemisphere is now approaching winter. A comparison of the maps immediately above shows a dark band near the South Pole which is larger in the later image, because that side of the planet is turning away from the Sun (and us), and is moving into a more than century long polar night. So as defined by the maps, it is the North Pole which is approaching summer. This means that the difference between the maps and the rotational diagram is due to a change in the definition of which pole is which. Traditionally the North Pole of a planet was defined as the one at which the planet rotated to the left and the stars to the right, as at our North Pole. For a planet with retrograde rotation such as Pluto, this would put the North Pole on the south side of the Solar System as defined by our rotation. To avoid the confusion this might cause, in recent years planets such as Pluto have had their North Poles redefined as the one on the north side of the Solar System as defined by the Earth's rotation, so the pole that used to be called North is now called South, and vice-versa (obviously, this means that diagrams such as this should now include a caption stating how North and South are being defined).

(Image credit Elliot, Dunham, Bosh, Slivan, Young, Wasserman, Millis, Kuiper Airborne Observatory, Icarus)Study of the Plutonian atmosphere by the occultation of a star on June 9, 1988. If Pluto had no atmosphere the light curve would have vertical sides, but instead, it has sloped sides whose exact shape can be used to determine the density profile of the atmosphere (how the scale height changes at different altitudes). Based on the density profile and the low gravity of the planet, the average molecular weight can be determined, and is about 28, which suggests that diatomic nitrogen molecules are the primary component of the atmosphere. Absorption at specific wavelengths also suggests the presence of small (about 1%?) amounts of methane. The atmosphere appears to consist of an isothermal (constant temperature) outer atmosphere and a complex (variable temperature) lower atmosphere, possibly including an inversion layer (a region where temperature decreases with altitude, as in our stratosphere). If so that would make Pluto the only planet other than the Earth known to have an inversion layer.

(Image credit NACO Team, 8.2-meter VLT (Yepun), ESO, apod020911)Pluto and Charon as they passed by members of the triple star system P126, in 2002. Pluto passed in front of P126A, casting a shadow the size of Pluto across parts of South America, providing more detailed information about its size and atmospheric structure. Among other things it was discovered that the atmospheric pressure had doubled (from 1.5 microbars to 3 microbars) since 1988, suggesting a warming of about 2 1/2 Fahrenheit degrees, presumably caused by the fact that although it is now moving away from the Sun, Pluto is still considerably closer than its average distance, and is still warming up. However, as it moves away from the Sun it is also turning one pole more directly away from it, which will soon cause gases forming on the sunward side to freeze out on the night side; as a result, it is expected that the atmospheric pressure will soon begin to decrease.

One model of internal structures of Pluto and Charon
(McKinnon & Mueller, Simonelli et al)

(Image credit Lunar and Planetary Laboratory, NASA Gallery)
This model of the internal structure of Pluto is completely different from the previous one, showing the uncertainty involved in calculating the structures of objects when accurate data are scarce or nonexistent.

Relative size of various large moons, and Pluto. (NASA, Wikimedia Commons)

Relative sizes of the largest known trans-Neptunian objects (Pluto and KBOs), as of early 2007
(relabeled NASA illustration)
|