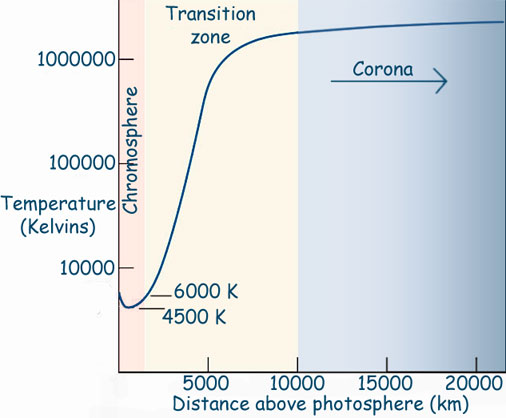
The temperature structure of the Solar atmosphere. Temperatures are lowest in the photosphere (which is about as thick as the line at the left-hand side of the chromosphere) and lower chromosphere, then rapidly rise in the transition zone (the upper part of the chromosphere) to more than two million Kelvins (nearly four million Fahrenheit degrees) in the corona.
The Surface of the Sun: The Photosphere
Because the Sun is so bright we normally have to cut down on its brightness by hundreds of thousands of times to get a properly exposed image of its surface. When we do this the atmosphere isn't visible at all, as seen in the image below. Despite being so perfectly exposed that it clearly shows limb darkening and faculae, there is no hint of the regions above the solar surface.
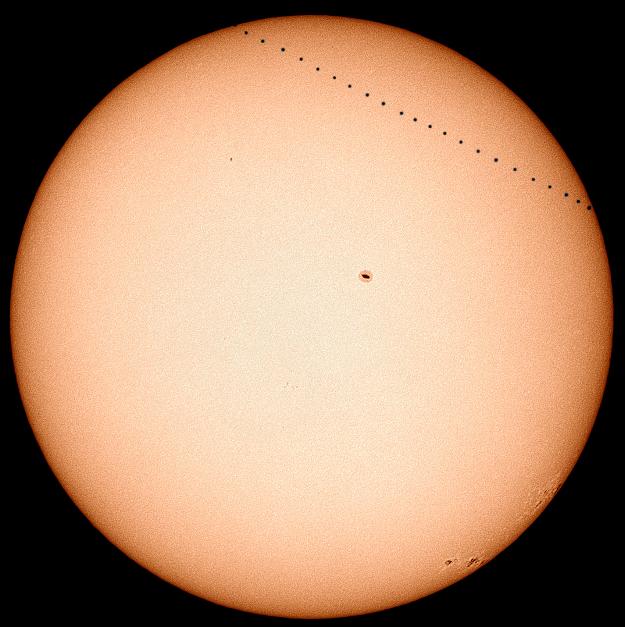 The Sun in visible light, showing a relatively "clear" surface with only a few sunspots. The series of black dots in the upper right hand corner is a multiple exposure of the May 7, 2003 transit of Mercury. 23 images were taken about 15 minutes apart on a single frame of film, during a period of more than 5 hours. Note the darkening of the image near the "edge" or "limb" of the Sun, and the bright regions or "faculae" surrounding the sunspots at lower right. (Dominique Dierick, apod030527)
Granulation
Granulation is a sort of "boiling rice" pattern visible on the photosphere. It is caused by vertical mixing motions in the convective zone, just below the surface of the Sun. Hot blobs of gas a few hundred miles across move upward at five to ten miles per second (faster than the speed of sound in the photosphere, but much slower than the speed of sound in the convective zone), cool off by radiating heat, then sink into the interior. As they rise the hot blobs lift the surface and radiate more energy; as they sink they pull the surface down and radiate less energy. Therefore, the higher portions of the granulation are brighter compared to the lower portions. The granulations form, change and reform over periods of the order of ten to twenty minutes.
 Detailed image of solar granulation in a "first-light" demonstration of the capabilities of the Hinode space telescope. The bright spots between the granules are regions of strong magnetism. JAXA)

Closeup of granulation and sunspots on the limb of the Sun.
(G. Scharmer (ISP, RSAS) et al, Lockheed-Martin Solar & Astrophysics Lab, apod030624)

Closeup of granulation and a sunspot near the center of the Sun.
(Vacuum Tower Telescope, NSO, NOAO, apod051106)
The Chromosphere
We can see the chromosphere, the region just above the photosphere, by taking a spectroheliogram, an image of the Sun using only one wavelength of light which is strongly absorbed by the gases in the layers above the surface. One such wavelength is the longest wavelength of the Balmer series of hydrogen absorption, referred to as H-alpha (Hα). The images below show the chromosphere in the light of this wavelength.
 This Hα (H-alpha) image, which emphasizes prominences, chromospheric detail and spot-related activity, shows sunspot region 875 (near bottom right) developing a relatively low energy (class C) solar flare in late April 2006. (Greg Piepol (sungazer.net), apod060502)

Gases cooled by powerful magnetic fields condense, forming dark filaments against the chromosphere and bright prominences against the corona (size of the Earth shown for comparison). Prominences appear to be hotter than usual regions but are actually cooler than usual (due to cooling by the solar magnetic field). Being cooler they become denser (motion-pictures show material forming near them, apparently out of nothing, joining the prominence and sinking toward the surface). Being denser they block more of the light from below, creating the darker appearance they exhibit when seen in front of the Sun as filaments. But after absorbing the light they reradiate it in random directions. When seen on the side of the Sun, against the black of empty space, the denser regions, having absorbed more light, radiate more light and therefore appear as bright prominences. (Didier Favre, spaceweather)
 Another image of the Sun taken in the Hα line, showing detail in the chromosphere. Note the bright regions surrounding sunspots, and at upper left the darker areas or filaments where denser, cooler regions in the chromosphere more strongly absorb the light from below. To the left of that are prominences -- the same thing as filaments but observed from the side -- where the excess absorption of the denser gases is reradiated as excess light. (Robert Gendler, apod000110)
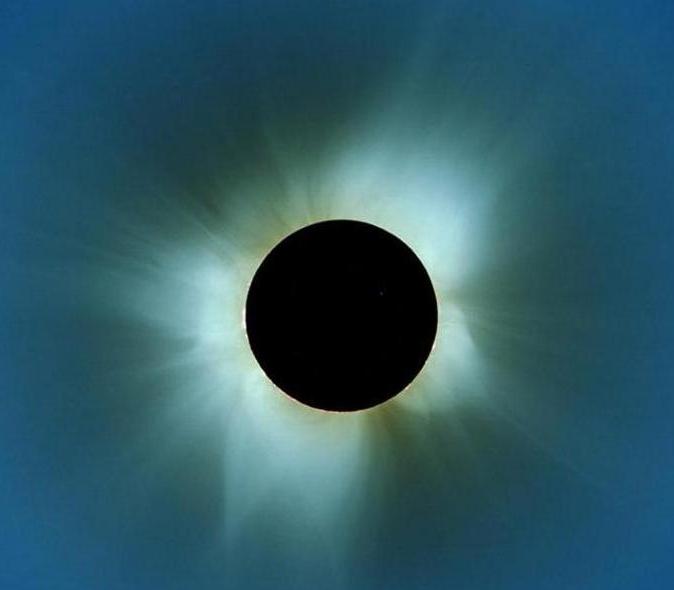
We can also see the atmosphere by simply blocking out the image of the Sun's disk, so that we don't have to cut down its light by hundreds of thousands of times. Nature sometimes does this for us with solar eclipses, as shown in the following images.
 Image of total solar eclipse of August 11, 1999 showing the chromosphere (the pinkish region surrounding the lunar disk) and the inner corona. The transition zone, which separates the corona from the chromosphere, is only a few thousand miles thick and appears in no way different from the regions above or below it. The prominences seen around the limb of the Moon extend from the chromosphere into the corona. If you were looking at a solar eclipse the corona would appear much larger than shown here, but film and electronic sensors have a much smaller latitude (range of sensitivity) than our eyes, and to properly expose the outer regions of the corona the image would have to overexpose the inner regions. (Michael Kobusch, apod010620)
The Corona
The corona is only easily visible during a solar eclipse or from space. With a coronagraph -- a telescope which blocks the image of the solar disk so that the chromosphere and corona can be seen -- the brightest portions of the corona can be studied; but even then scattered sunlight makes observations difficult. To study the fainter outer regions the darker skies created by a total solar eclipse are needed, or better yet the pitch-black of outer space.
 The solar corona photographed during the eclipse of December 4, 2002. A specially designed radial density filter shows fainter outer regions as clearly as brighter inner regions. With such techniques an even better view of the corona can be obtained than with direct observation. (Wendy Carlos & Jonathan Kern, apod021213)
 The solar corona photographed during the eclipse of March 29, 2006. Superposition of a series of very short exposure images, combined with computer-based enhancement of the contrast and brightness of those images, provides a still more detailed view of the structure of the corona and strongly hints at the presence of the magnetic field lines -- particularly near the poles -- that control the structure of the outer solar atmosphere. (Koen van Gorp, apod060407)
 The solar corona, photographed during the eclipse of July 22, 2009. Aside from giving an excellent view of the Sun's outer atmosphere, this composite image faintly shows the near side of the Moon, illuminated by earthlight (the light reflected from a full Earth as seen from the Moon). Note that the features visible on the lunar surface are the same as always, since the Moon always keeps the same face to the Earth. (Image reproduced by permission of Copyright holder: Miloslav Druckmüller, Peter Aniol, Vojtech Ruin, Lubomir Klocok, Karel Martiek, Martin Dietzel)
 Coronal arcs (magnetic field loops) photographed November 9, 2000. As the lines of flux extending from the surface into the corona change their strength and direction there is an occasional situation where two lines might try to cross, if they could. But since the direction of the field lines shows the direction of the force exerted by the field, and that can't be in two directions at once, it is impossible for the lines to cross; instead, they collapse to form a single line, and as they do so the gas between them is accelerated to high velocities corresponding to millions of degrees, and ejected along the field lines into the corona. It is now thought that this is why the corona is so hot. (TRACE Project, NASA, apod001115)

A composite of magnetic field measurements and an ultraviolet image of the Sun obtained with the Solar Dynamics Observatory on May 23, 2010. Orange and blue are used to indicate regions of opposite polarity in the lower solar corona, while yellow-green represents the UV image of coronal arcs. The juxtaposition makes it clear that the arcs extend out of the Sun where the magnetic polarity is upward, and plunge into it where the polarity is downward. (Courtesy of SDO (NASA) and the [AIA, EVE, and/or HMI] consortium)

Above, a Solar Dynamics Observatory image of the solar corona on August 21, 2010 showing a large coronal hole (the dark region). The image below, taken a few hours earlier, superimposes magnetic field lines calculated from SDO measurements. The closed loops (in white) represent regions where the solar atmosphere is held in by its magnetic field. The open lines (in pale yellow) represent regions where the magnetic field lines extend into space, allowing portions of the atmosphere (that is, the solar wind) to escape into space. Coronal holes represent regions where field lines have become detached from the Sun, and when they are numerous, the solar wind is denser and more energetic. As holes rotate onto our side of the Sun, the resulting increase in the solar wind's strength can cause more intense auroral displays (although the most intense storms are caused by Coronal Mass Ejections). (Images courtesy of SDO (NASA) and the [AIA, EVE, and/or HMI] consortium (field line imaging by Karel Schrijver, Lockheed Martin SAL); originals shown here)

Although the corona has a more complex structure when the photosphere is covered with spots, the two regions can display completely different levels of activity. The image above, taken the day before the images of the corona and coronal holes directly above it, shows a completely spotless Sun. The only features visible (most easily, near the upper right limb) are some faculae, regions where the tendency of strong magnetic fields to hold in the Sun's energy results in an increased release of energy in surrounding regions. (Image courtesy of SDO (NASA) and the [AIA, EVE, and/or HMI] consortium; original shown here) |