A Brief Discussion of Some Topics Illustrated Below
Over a period averaging around 11 years, referred to as a cycle of solar activity or a sunspot cycle, the magnetic field of the Sun, created by convection motions in its interior -- according to current theory, most particularly in a region at the base of the convective zone where the fluid motions are rapidly changing, called the tachocline (from the Greek tacho, meaning swift, as in tachometer; plus cline, meaning bed or region) -- is twisted by the Sun's differential rotation until it becomes much stronger than usual at certain places and times. When the field is strong enough it suppresses the vertical motion of the gases in the region below the surface, and because most of the heat transfer in those regions is caused by that vertical motion the surface is unable to replace the heat it is radiating away and cools. Once it has cooled enough to make its radiation noticeably less than normal it appears as a darker than usual region on the surface -- a sunspot.
It might be expected that when the Sun has sunspots, less heat would be reaching the surface and escaping into space and the Sun would be fainter (by a minuscule amount) than usual. But the heat that is unable to reach the surface increases the temperature below the surface, and as the regions below the sunspot become hotter they radiate more than their usual amount of heat, and heat flows from them into the surrounding regions. Those regions, unaffected by the magnetic field which causes the sunspot (which is very localized), radiate their greater than normal amount of heat to the surface, causing regions around the sunspot to be brighter than normal.
It is not usually possible to see the excess light from the regions surrounding sunspots, because the normal surface radiation is so intense; but near the limb of the Sun limb darkening makes the surface fainter than near the center of the solar disk, and the excess light can be seen as faculae. The excess radiation can also be seen in chromospheric images or spectroheliograms, but the bright regions there are called plages. Both names refer to the same thing seen at different altitudes in the solar atmosphere, in different ways; an excess of heat radiating around the darker sunspots.
The excess radiation coming out of the Sun at plages and faculae is greater than the deficit of radiation at the sunspots, and as a result the Sun is actually brighter (by a minuscule amount) when it has sunspots than when it does not.
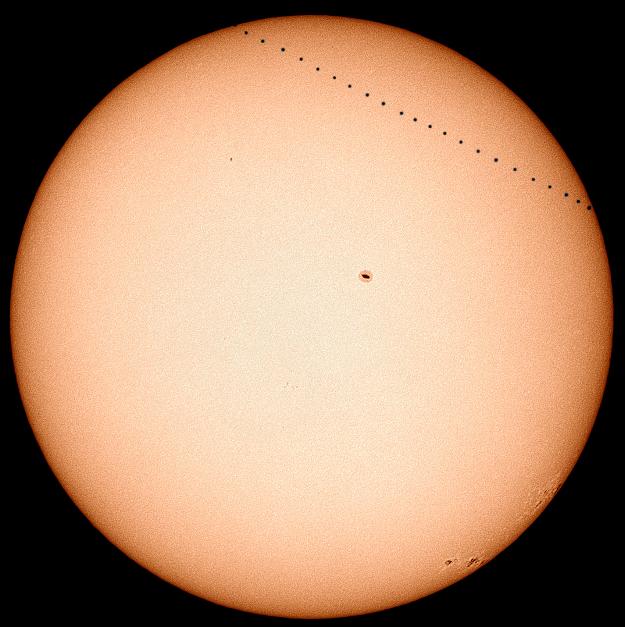 The Sun in visible light, showing a relatively "clear" surface with only a few sunspots. The series of black dots in the upper right hand corner is a multiple exposure of the May 7, 2003 transit of Mercury. 23 images were taken about 15 minutes apart on a single frame of film during a period of more than 5 hours. Note the bright areas (faculae) surrounding sunspots near the limb of the Sun, on the lower right. (Dominique Dierick, apod030527)
 A sunspot group larger than Jupiter (#10484), and another one trailing it (on the left -- #10486). Such large spots are relatively rare, especially three years after solar maximum (October 2003). (Juan Carlos Casado, apod031027)
 Light bridges cross the central portion of a sunspot in April of 2000, while filaments swarm around the spot. Over the next few days the spots on the left and right separated, while the bridges expanded to fill the void. (G. Scharmer, L. Rouppe van der Voort (KVA) et al., SVST, apod000522)
 Extreme closeup of a sunspot -- the sharpest image obtained as of 2002 (taken on July 15, using an adaptive-optics telescope), showing details less than 100 miles across. The umbra, or dark portion of the spot, is about 8000 miles across (as big as the entire Earth). Note the filamentary structure of the penumbra -- the lighter portion surrounding the umbra -- caused by the magnetic fields extending through the region, and the granulations on the normal surface of the Sun, surrounding the penumbra. Below the spot the strong magnetic field which causes it suppresses the normal convection, resulting in a lesser upward movement of heat than usual, and causing the surface to cool and become darker. The heat which is prevented from reaching the surface radiates into the surrounding regions below the surface, and escapes all around the spot as the faculae seen in the image at the top of the page. (SST, Royal Swedish Academy of Sciences, apod021114)
 Even at solar minimum there are usually some spots on the Sun; but this image, taken on Feb 10, 2006, shows a relative rarity, an absolutely spot-free Sun. (SOHO)

Sunspots and the Solar magnetic field.
(Image temporarily borrowed from Chaisson & McMillan, Astronomy Today)
 The cycle of solar activity, shown as the area covered by spots each day, averaged over a month (top) and as the area covered at various latitudes each day, averaged over a month (bottom), from 1875 to 2005. The latitude graph shows the "butterfly" pattern (named after its similarity to the wings of a butterfly) caused by spots appearing near mid-latitudes at the start of a solar cycle, and closer to the Equator near the end of the cycle. (David H. Hathaway, NASA, NSSTC, spaceweather.com)

Yearly average sunspot numbers over the last four centuries. (NASA)

Monthly average sunspot numbers from 1750 to 2005. (NASA)
 The brightness of the Sun over the last two decades, overlaid in black to compare it to the sunspot cycle. Note that when there are more sunspots the Sun is slightly brighter than when there are fewer sunspots. This defies common sense, because when there are more sunspots less radiation penetrates the surface where the dark sunspots are located; but the heat that is prevented from reaching the surface builds up beneath the surface, and the higher temperatures that result cause even more radiation than usual to leak to surrounding areas and from there, upwards to the regions surrounding the spots. When viewing the photosphere, it is hard to see the excess heat leaking from the surrounding regions, but near the limb of the Sun, or in chromospheric images (spectroheliograms), the brighter areas surrounding sunspots are easily visible as faculae or plages; and as it turns out, the excess radiation from these reiongs more than makes up for the deficit of radiation from sunspots. (radiance overlay from NASA data, graphed by William Connelly; solar cycle smoothed image from other sources)

Changes in (X-ray wavelength) Solar appearance during the Solar cycle of activity.
(NOAA+Zurich+RDCX (D.V.Hoyt) + CNRS/INSU (J.P.Legrand) + Ondrejov Obs. (K.Krivsky))
 The change in Solar X-radiation from an active Sun (1991, left) to a quiet Sun (1995, right), demonstrated by superposing images taken by the Yohkoh Satellite at 4-month intervals. The satellite suffered a catastrophic guidance failure in 2001, and is no longer active. (NASA, Yohkoh Science Project, YPOP) |